Commentary
2024 wrap up and 2025 outlook: The year in charts
December 19, 2024

As we look back on 2024, we saw the equity market prove itself to be a testament to resilience, and a return to speculative activity last seen since before the pandemic.
Below is a selection of charts that our team found to be particularly impactful, highlighting the environment we witnessed in 2024 and, more importantly, why we’re excited for 2025.
Speculation
This year has been the year of the US equity markets, particularly the mega cap Magnificent Seven, up over 60% in 2024. The speculative fervour that gripped the United States has reached fever pitch. The best way to measure it may actually not be Bitcoin – even though it has more than tripled this year to trade above $100,000.
Have you heard of Fartcoin? Yes, you read that correctly. Just so you know, the coin is up over 1,000% since the US elections on November 5.
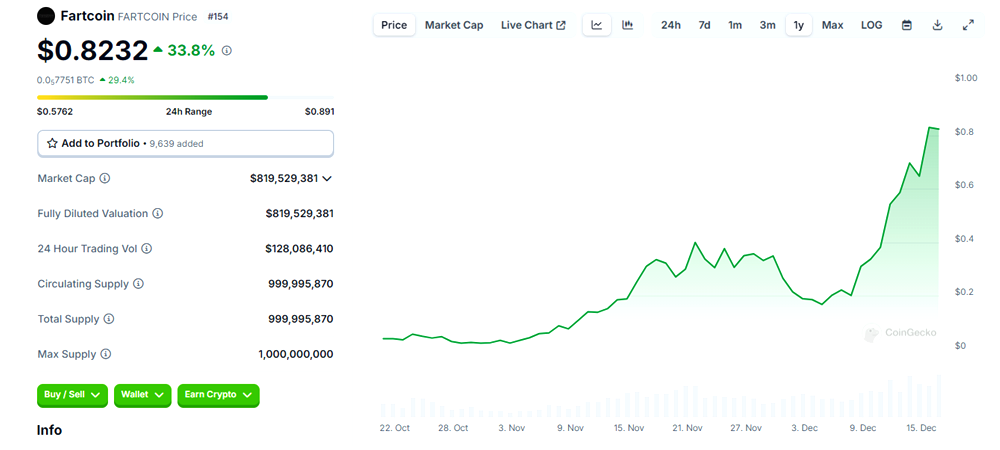
Source: CoinGecko
Not bad for a cryptocurrency that allows users to submit fart jokes or memes to claim initial tokens. Over USD60 million is traded every day; with a market cap of $830 million, it is the 189th largest cryptocurrency. We are in uncharted territories.
Regional market concentration
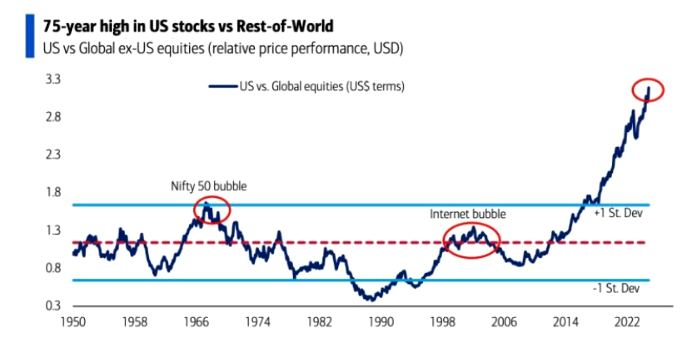
Source: BofA Global Investment Strategy, Global Financial Data, Bloomberg
The concentration of the gap in valuation between US stocks and the rest of the world is driving up the valuation of US stocks to extreme levels. Global markets have been tumultuous since the pandemic, but with the rush for AI and technology, the US market has shown to be the most resilient, therefore drawing investors from abroad in droves.
Top ten concentration
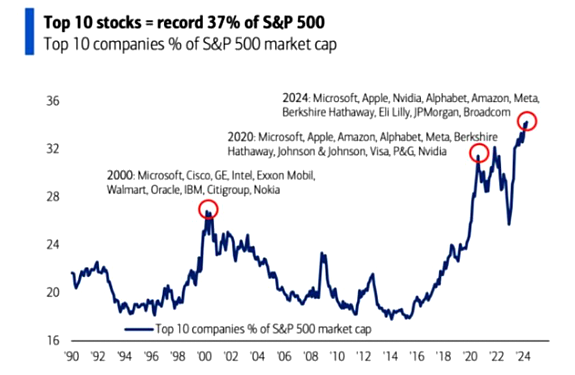
Source: BofA Global Investment Strategy
Regarding the gap between the top-10 stocks in the S&P 500 and the remaining 490, a similar divergence is taking place when we examine equity market flows. In fact, the best way to measure the fervour is in the investor concentration towards US equities, specifically the S&P 500. With the Magnificent Seven making up nearly 50% of the S&P 500’s gain, this high is volatile. Any earnings slowdown or unfavourable news within this seven could result in outsized impacts on the overall performance.
We will let you judge if this a risky environment or not. To quote Mark Twain, “History doesn’t repeat itself, but it often rhymes.”
Instead of trying to find reasons why this market might correct, allow us to concentrate on what we see as opportunities.
Global opportunities outside of the United States
We’ve written numerous pieces on opportunities within small caps in Japan, Europe and emerging markets this year, so it’s no surprise when we say that we believe that the Japanese economy will be the fastest growing developed market economy in 2025.
The country has turned the corner on deflation. The virtuous wage/price spiral has taken hold. Pay rose 3.6% for base pay and 5.17% in total pay in 2024. We expect a similar increase in 2025. Interest rates will probably rise another 0.5%. Japan is a beneficiary of mega trends, from friendshoring to AI, semi-conductor investments to green transition. A newly announced ¥39 trillion fiscal package will help even further. As a result, a stronger economy with a large discount in Japanese companies’ valuations and investor-friendly measures such as M&A and buybacks mean Japan should be the top performing developed equity market in 2025.
In Europe, how a few years make a huge difference. Countries like Spain and Italy should be outperformers, as well as the UK and Sweden as these countries and their economies begin to turn.
For emerging markets, China will deploy fiscal stimulus that is similar to 2008, putting a floor on deflation risks, stimulating consumption and buoying the stock market. Given the underweight of most asset managers, it may mean healthy returns for the Chinese markets.
MSCI EAFE Small Cap minus Russell 2000
Source: Global Alpha Capital Management Ltd.
Since fall 2024, there has been a rotation into US small caps, fueled even more by the Trump Trade: Could we see international small caps catch up? One can observe the relative outperformance of EAFE small cap between 2002 and 2010. Seven years of underperformance is unprecedented. And we need to know that Japan is around 33% of the EAFE small cap index. According to the fundamentals and history, if there is a slowdown in the United States, international markets including international small caps could stand to be big beneficiaries.
Mergers and acquisitions
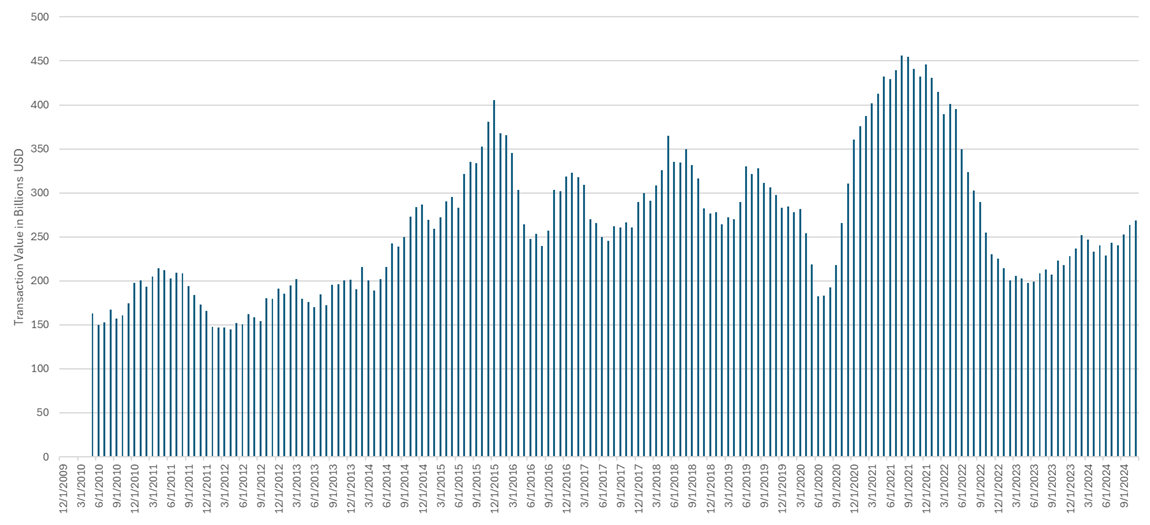
Source: Global Alpha Capital Management Ltd.
We have also recently seen a pick-up in M&A activity. A consensus is emerging from advisors like Goldman Sachs, Evercore and others that 2025 will be a record year. M&A activity is projected to be 15% greater 2024, which was already up 15% over 2023.
Source: Global Alpha Capital Management Ltd.
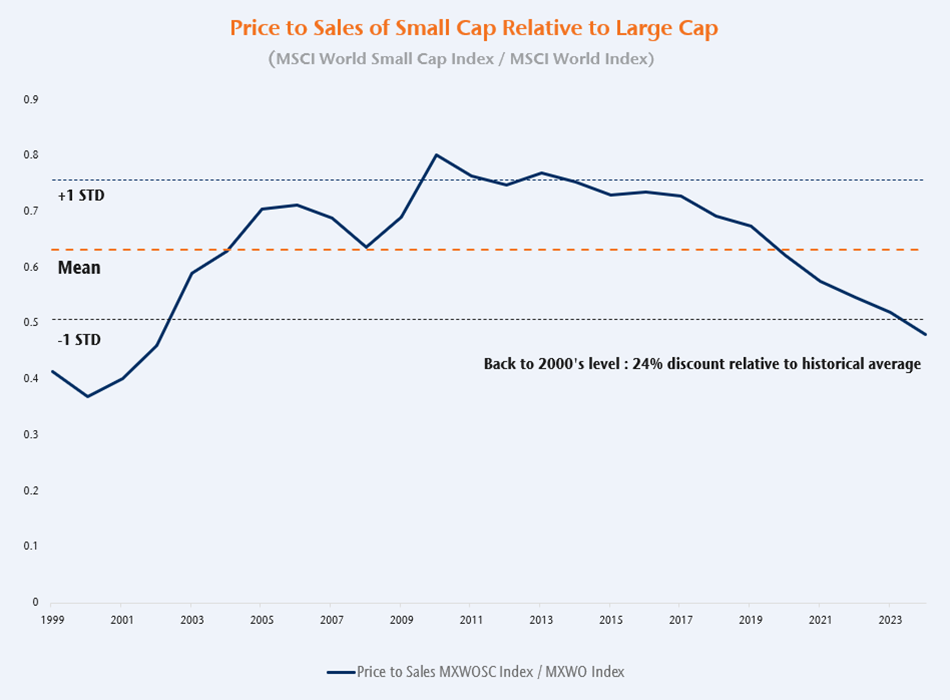
Finally, the relative valuations of global and EAFE small caps versus large cap indicate a once-in-a-few-decades opportunity.
Investments are currently overloaded into the US market, with an oversaturation in the Magnificent Seven stocks. But it is clear there is opportunity in small caps – particularly international small caps – therefore, this is an opportunity that excites our team going into 2025.
In closing, the entire team at Global Alpha would like to thank you for your trust, and we want to wish you a beautiful holiday season and a wonderful 2025 ahead.