Commentary
Is 3 the new 2
April 14, 2022

On July 8, 2021, our commentary addressed inflation and the debate about whether it was transitory or secular. At the time, the consensus of Central Bankers and most economists, was that it was transitory.
In this week’s commentary, we predict that a 2% inflation goal in the U.S. is not achievable for many years to come. The new long-term inflation rate will be more around 3%, and possibly higher. How central banks will adjust their policy to this new reality remains to be seen.
Inflation targeting: a history
Since 1996, the United States (U.S.) Fed has used monetary policy with the aim of keeping inflation at 2%. In 2012, Ben Bernanke, then chair of the Fed, made it explicit. Japan, Sweden, the European Central Bank (ECB), Canada, the Bank of England and many others have all since been using this 2% target.
Why 2%?
In the inflationary period of the late 70s and early 80s, inflation was high and central banks around the world tried to ensure stable prices using different methods (currency rates, growth of money supply, interest rates) all with the goal to bring down inflation, above 10% at the time. When inflation finally started to come down, inflation targeting became the norm, first specified by New Zealand in 1988. That meant normal interest rates would be around 4 to 5% and would be cut to no less than 2% in a recession to have the desired effect to boost the economy.
Unfortunately, central bankers did not respect their framework and cut rates to zero. This unleashed the inflation we are seeing today.
To justify their move to zero, Fed Chair Jerome Powell made a significant change to the 2% framework on August 27, 2020. The statement replaced the 2% commitment by a 2% average over time. They also added a goal of maximum employment.
What happened since and what will happen in the next few years will be material for future economic theses.
Here is an update of different prices since last summer. Remember, prices were supposed to go down in 2022.[1]
| Price of (in U.S.$) | June 28, 2019 | June 30, 2020 | June 30, 2021 | April 8, 2022 | % increase over 2019 |
| Oil (Bbl) | 58.47 | 39.27 | 73.90 | 96.23 | 65% |
| Natural gas (Mcf) | 2.31 | 1.75 | 3.65 | 6.39 | 276% |
| Gasoline (gallon) | 1.77 | 1.26 | 2.26 | 3.05 | 72% |
| Corn (Bushel) | 414 | 373 | 585 | 765 | 85% |
| Pork (lb) | 0.87 | 0.75 | 1.04 | 0.99 | 14% |
| CRB food index | 348 | 290 | 488 | 568 | 63% |
| Copper (MT) | 5993 | 6015 | 9335 | 10312 | 72% |
| Aluminium (MT) | 1820 | 1620 | 2552 | 3385 | 86% |
| Lumber (MBF) | 379 | 436 | 718 | 893 | 235% |
| CRB index | 408 | 360 | 557 | 633 | 55% |
| Baltic freight sea shipping | 1381 | 1799 | 3418 | 2778 | 201% |
Although major equity and bond markets have had a difficult start of the year in 2022, here is the performance of benchmarks since June 28, 2019.1
| Indices | Performance between June 28, 2019 and April 8, 2022 (in U.S.$) |
| S&P500 | 59.5% |
| Nasdaq | 77.8% |
| MSCI World | 46.3% |
| MSCI emerging markets | 14.2% |
| MSCI global small cap | 34.5% |
| Bloomberg U.S. Aggregate Bond Index | 0.42% |
Looking at the above returns would signal that bond and emerging market investors, who both have a deeper perspective on the risks of inflation, have a gloomier assessment of long-term inflation risks.
But let us come back to our 3% long-term inflation rate. Why will future inflation be higher than what we experienced in the last 30 or so years?
The consumer price index (CPI), which is the main measure of inflation, is organized into dozens of categories; the most important are:
- Shelter (32.4%)
- Food (14%)
- Transportation (14%, excluding motor fuel)
- Energy (7.5%)
- Medical care services (7%)
- Education and communication services (6%)
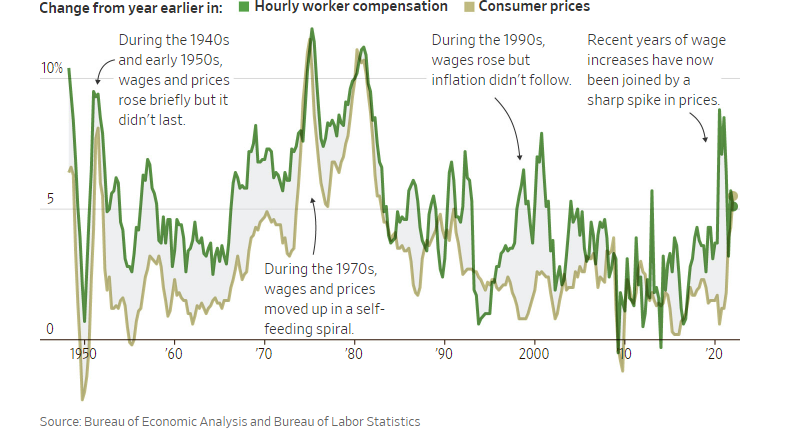
Another measure of inflation is wage growth. In the last year, wages were up 5.7%, below inflation at 7.3%. We argue that, going forward, wage growth will be above 3%, not dissimilar to the wage-price spiral of the 70s, whether it is deglobalization and reshoring, the millennials entering the work force, baby-boomers retiring, and wages going up.
We can see from the CPI categories that shelter is the largest component. With the rise in home prices, rents have not been far behind.
National real estate brokerage Redfin showed January’s average asking rents for housing went up 15.2% from last year. There is a lag between when rent increases occur and when they show up in the index, which is typically 18 months. This means that shelter inflation will be much higher in the months ahead.
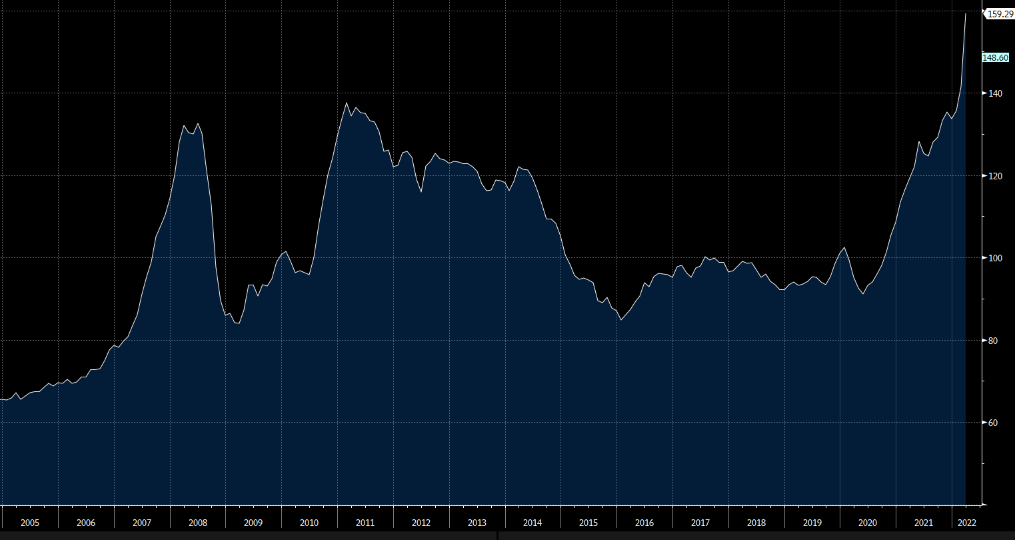
The second largest component is food. Typically more volatile, and excluded from the core CPI number, we believe that food prices will be higher in the future than they were in the past. From the decline in arable land, to more extreme weather events, to rising input costs, we can expect higher food prices. The last spike in 2011 brought extreme unrest around the World (Arab Spring).
Costly Food
What do we think today? How do we position one’s portfolio? How will equity markets react to these higher inflation numbers and higher interest rates?
Past episodes have shown that long-duration assets, such as long-term bonds and high growth stocks, will be most affected.
U.S. large cap, particularly technology companies, are selling at important premiums to other markets. They will be most vulnerable.
Japan and Europe do not have the same inflation pressures. So inflation there may be more contained. Smaller companies have generally outperformed in periods of inflation.
From January 1979 to July 1983, the Russell 2000 outperformed the S&P 500 by 77%. During this time, inflation rose to as high as 13% and the economy suffered a double-dip recession in 1980 and 1981-82, before staging an extremely strong recovery in 1983 with growth rates as high as 8.5%.
Our portfolio is well positioned for a strong recovery, accompanied by higher inflation.
[1] Bloomberg